Crosstabs are some tricky queries, so hopefully this wont get too hairy.
Just playing around with the Access' create Query Wizard allowed me to create a Crosstab that has a SQL like this:
- TRANSFORM Count(StudentAttendance.ID) AS CountOfID
-
SELECT StudentAttendance.StudentID, Count(StudentAttendance.ID) AS [Total Of ID]
-
FROM StudentAttendance
-
GROUP BY StudentAttendance.StudentID
-
PIVOT Format([AttendanceDate],"mmm") In ("Jan","Feb","Mar","Apr","May","Jun","Jul","Aug","Sep","Oct","Nov","Dec")
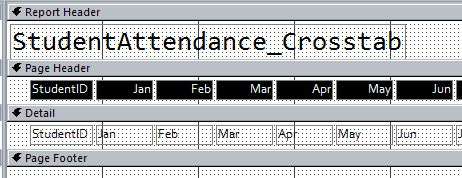
it looks like this in the QBE:

The nice thing about this is that it has the Column Headers without the Year, meaning that it will have the same Name for the Column Headers no matter what year it is.
With something like this, the only thing left to do would be put the date range at the top, and limit the report to a year at a time or otherwise the Months would total across the years. i.e. January 2017 and January 2016 would both be totaled into one number. It would be pretty simple if the report was limited to only one year at a time, but that might not work for you.
I'm curious of what you think.